

ChatBI is a conversational Business Intelligence system developed at Tencent TEG, enabling business users to query and visualize enterprise data through natural language without requiring SQL expertise or manual table discovery.
Part I: Business Problem
Enterprise BI workflows impose a steep technical barrier: analysts must manually navigate thousands of data tables, understand metadata schemas, and write SQL queries before any insight can be extracted. Business users without engineering backgrounds are effectively locked out, while even experienced analysts spend a disproportionate share of their time on data discovery rather than analysis.
| Challenge | Description |
|---|---|
| Table Discovery | Identify relevant tables and fields from a catalog of thousands, requiring joint understanding of user intent, metadata semantics, and access permissions. |
| Data Visualization | Produce clear, interactive visualizations through chart type selection, field-to-axis mapping, aggregation logic, and rendering. |
Part II: Architecture
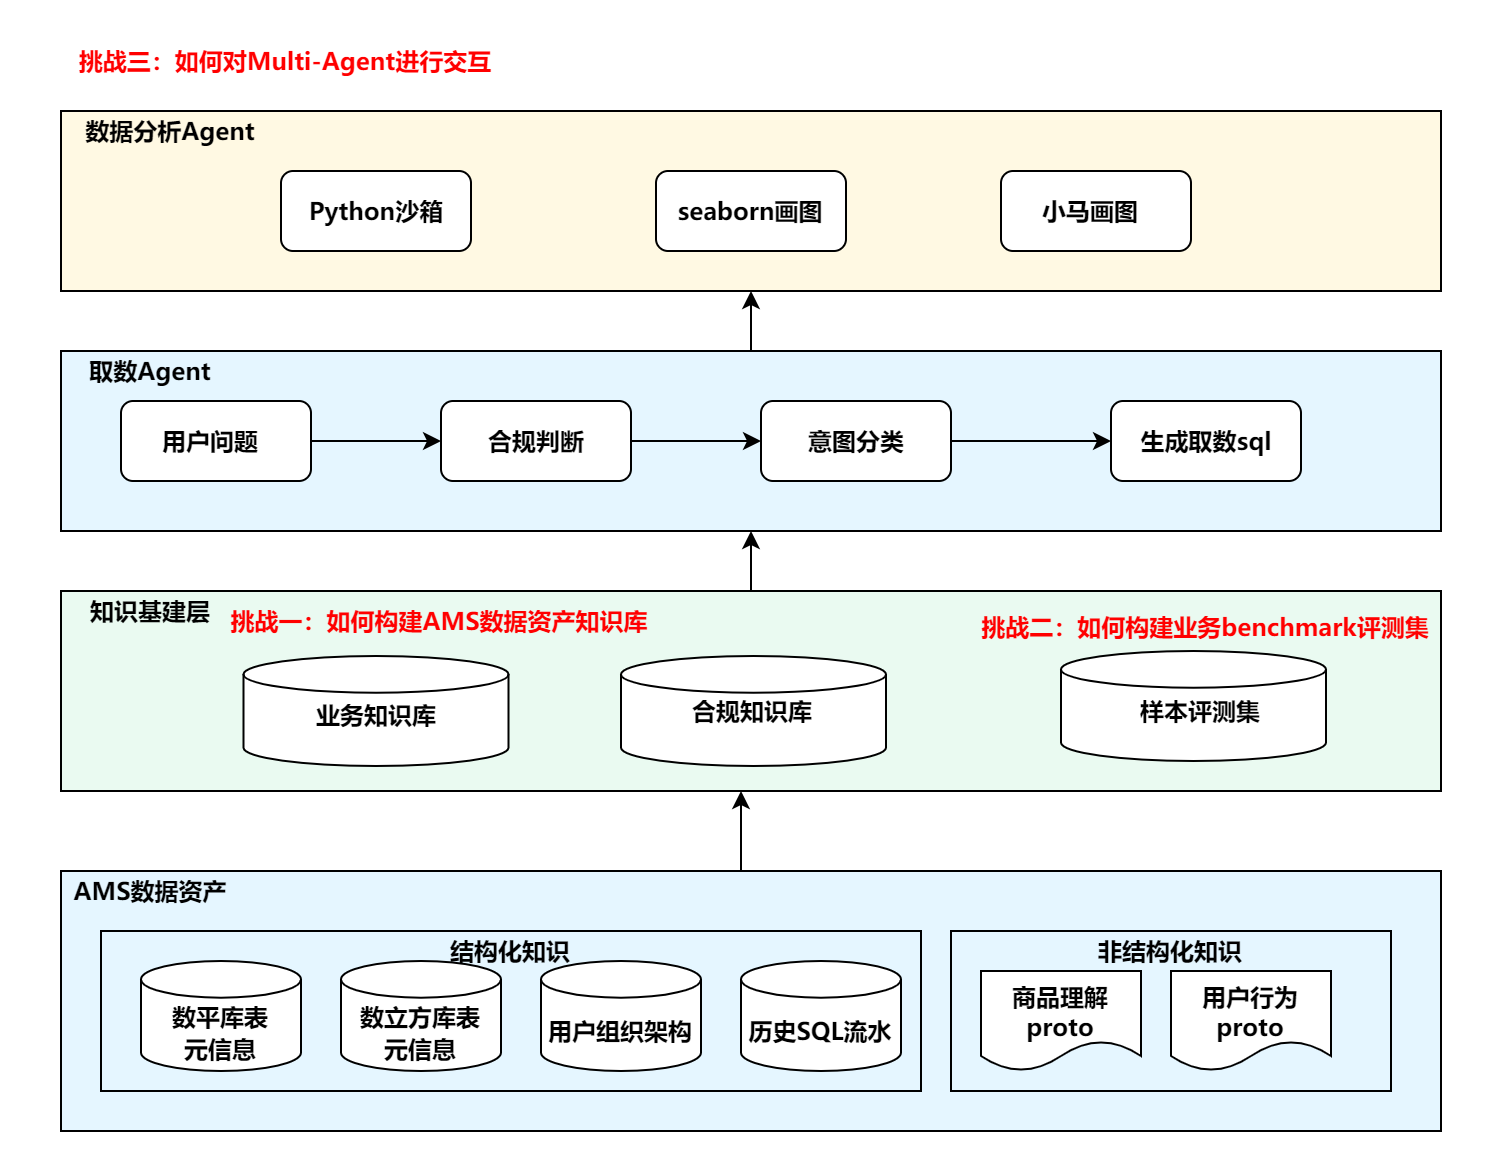
ChatBI is organized into three stacked layers, each building on the one below.
Layer 1 — Knowledge Foundation sits at the base. Raw AMS data assets—structured metadata (table schemas, data cube definitions, org hierarchies, historical SQL logs) and unstructured signals (product and user behavior protos)—are ingested and processed into a business knowledge base, a compliance knowledge base, and a benchmark evaluation set.
Layer 2 — Data Retrieval Agent handles the full query pipeline. An incoming question first passes through compliance checking; non-compliant queries are rejected before any data is accessed. Compliant queries proceed to intent classification, which routes the request and ultimately produces a SQL query for data retrieval.
Layer 3 — Data Analysis Agent receives the retrieved data and generates the final response, dispatching to a Python sandbox for statistical computation, an interactive chart renderer for BI charts, or Seaborn for static visualizations.
Part III: Knowledge Base

The knowledge base is constructed through a four-layer pipeline modeled after a data warehouse architecture.
Raw Layer (ODS) ingests data as-is from two source types: structured knowledge (table and data cube metadata, field sensitivity levels, user org hierarchy) and unstructured knowledge (product understanding and user behavior protos).
Unified Processing Layer applies a sequential ETL pipeline—read, clean, format, load—normalizing all knowledge into a consistent, queryable schema regardless of origin.
Detail Layer (DWD) organizes processed knowledge into three domain-specific stores:
| Knowledge Base | Contents |
|---|---|
| Table Metadata KB | Table schemas, field descriptions, data cube definitions |
| Compliance KB | Field sensitivity levels, user organization and permission hierarchy |
| Business KB | Enriched metadata annotations, data quality signals, domain context |
Application Layer exposes these stores to four downstream tasks: compliance checking, data interpretation, text-to-SQL, and insight generation.
For text-to-SQL retrieval, a Keyword Extraction Agent rewrites the user question into a retrieval-optimized query, a Table Name Recognition Agent handles explicit table references via direct lookup, and an Embedding Retriever performs Top-K semantic search with TF-IDF reranking over column fields. Hybrid scoring and permission-based filtering produce the final candidate table schemas.
Part IV: Multi-Agent Interaction
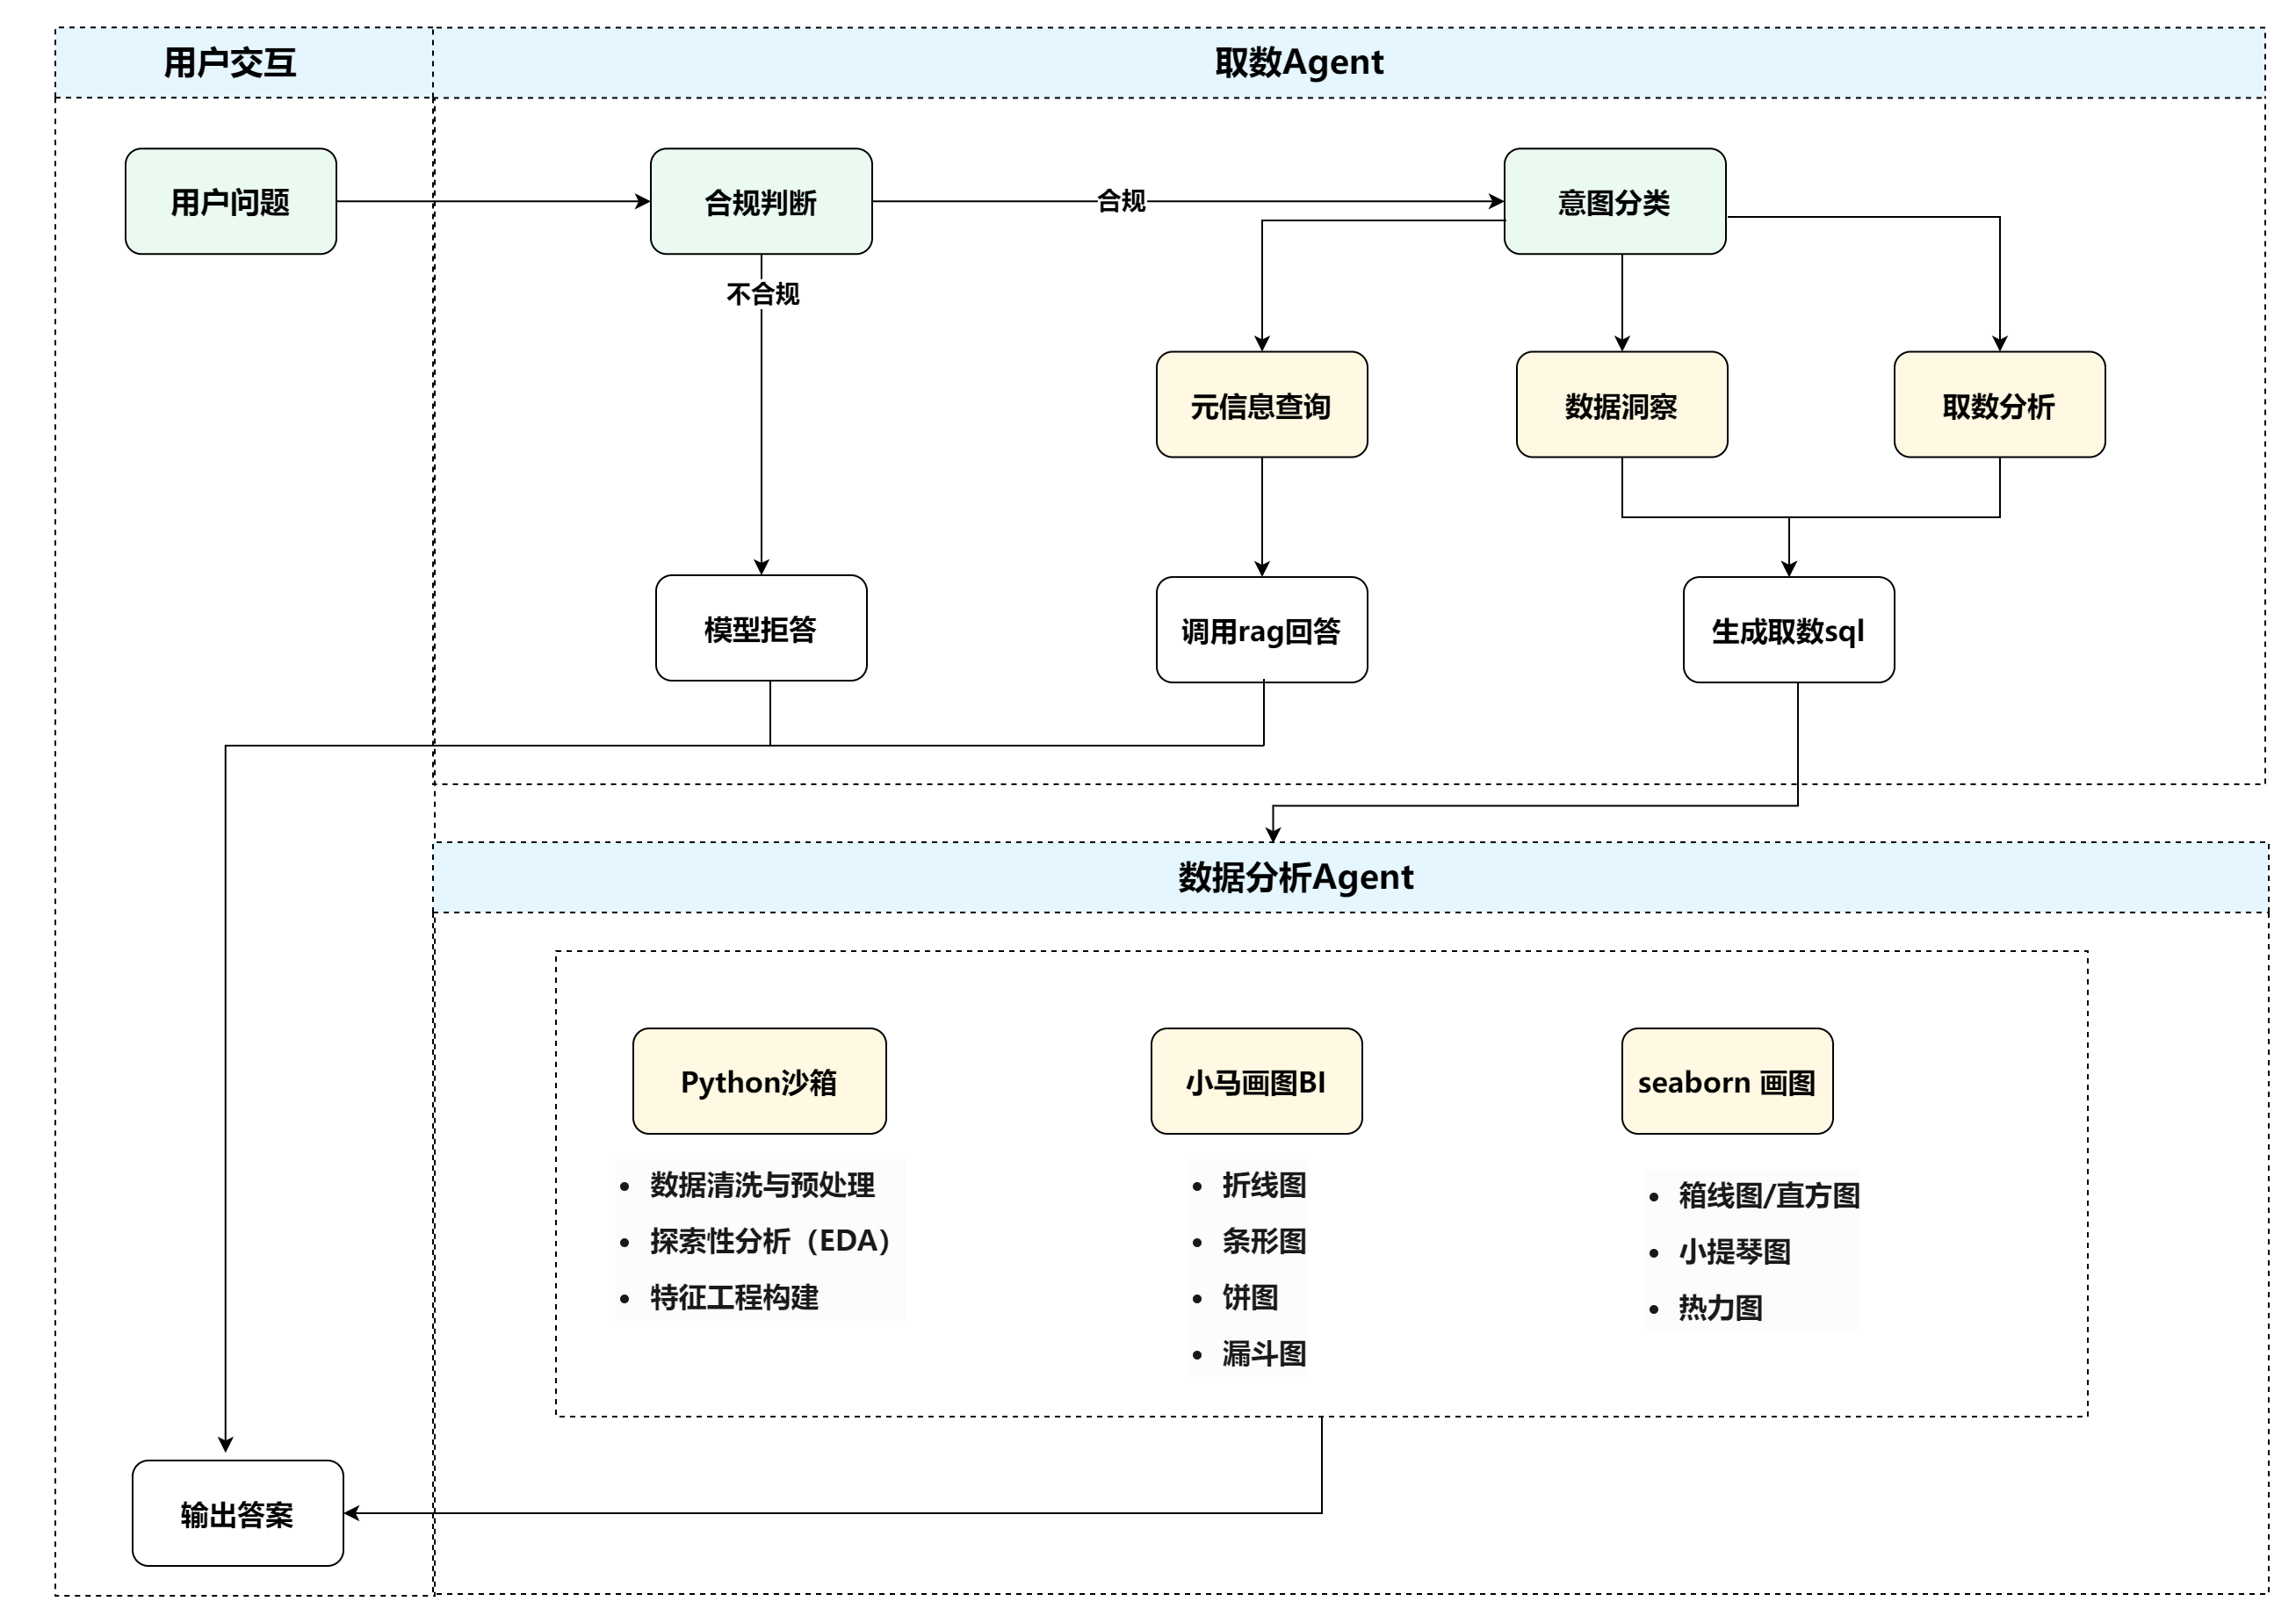
The end-to-end pipeline is executed by two cooperating agents: a Data Retrieval Agent for query understanding and data access, and a Data Analysis Agent for processing and response generation.
Data Retrieval Agent
Every question is first evaluated by a compliance checker. Non-compliant queries are refused immediately. Compliant queries go to intent classification, which routes along one of three paths:
| Intent | Handler | Output |
|---|---|---|
| Metadata query | RAG retrieval | Direct answer from knowledge base |
| Data insight | RAG retrieval | Insight narrative from retrieved context |
| Data analysis | text2sql pipeline | Executable SQL query |
Data Analysis Agent
Once data is retrieved, the agent selects the appropriate tool:
| Tool | Capabilities |
|---|---|
| Python Sandbox | Data cleaning, exploratory analysis, statistical modeling |
| Chart Renderer (BI) | Interactive line, bar, pie, and funnel charts |
| Seaborn | Static box plots, histograms, violin plots, heatmaps |
For interactive charts, a dedicated sub-agent first extracts chart configuration—dimensions, metrics, aggregation methods, axis mappings—into a validated JSON Schema before passing it to the renderer, preventing hallucinated field names from reaching the visualization layer.